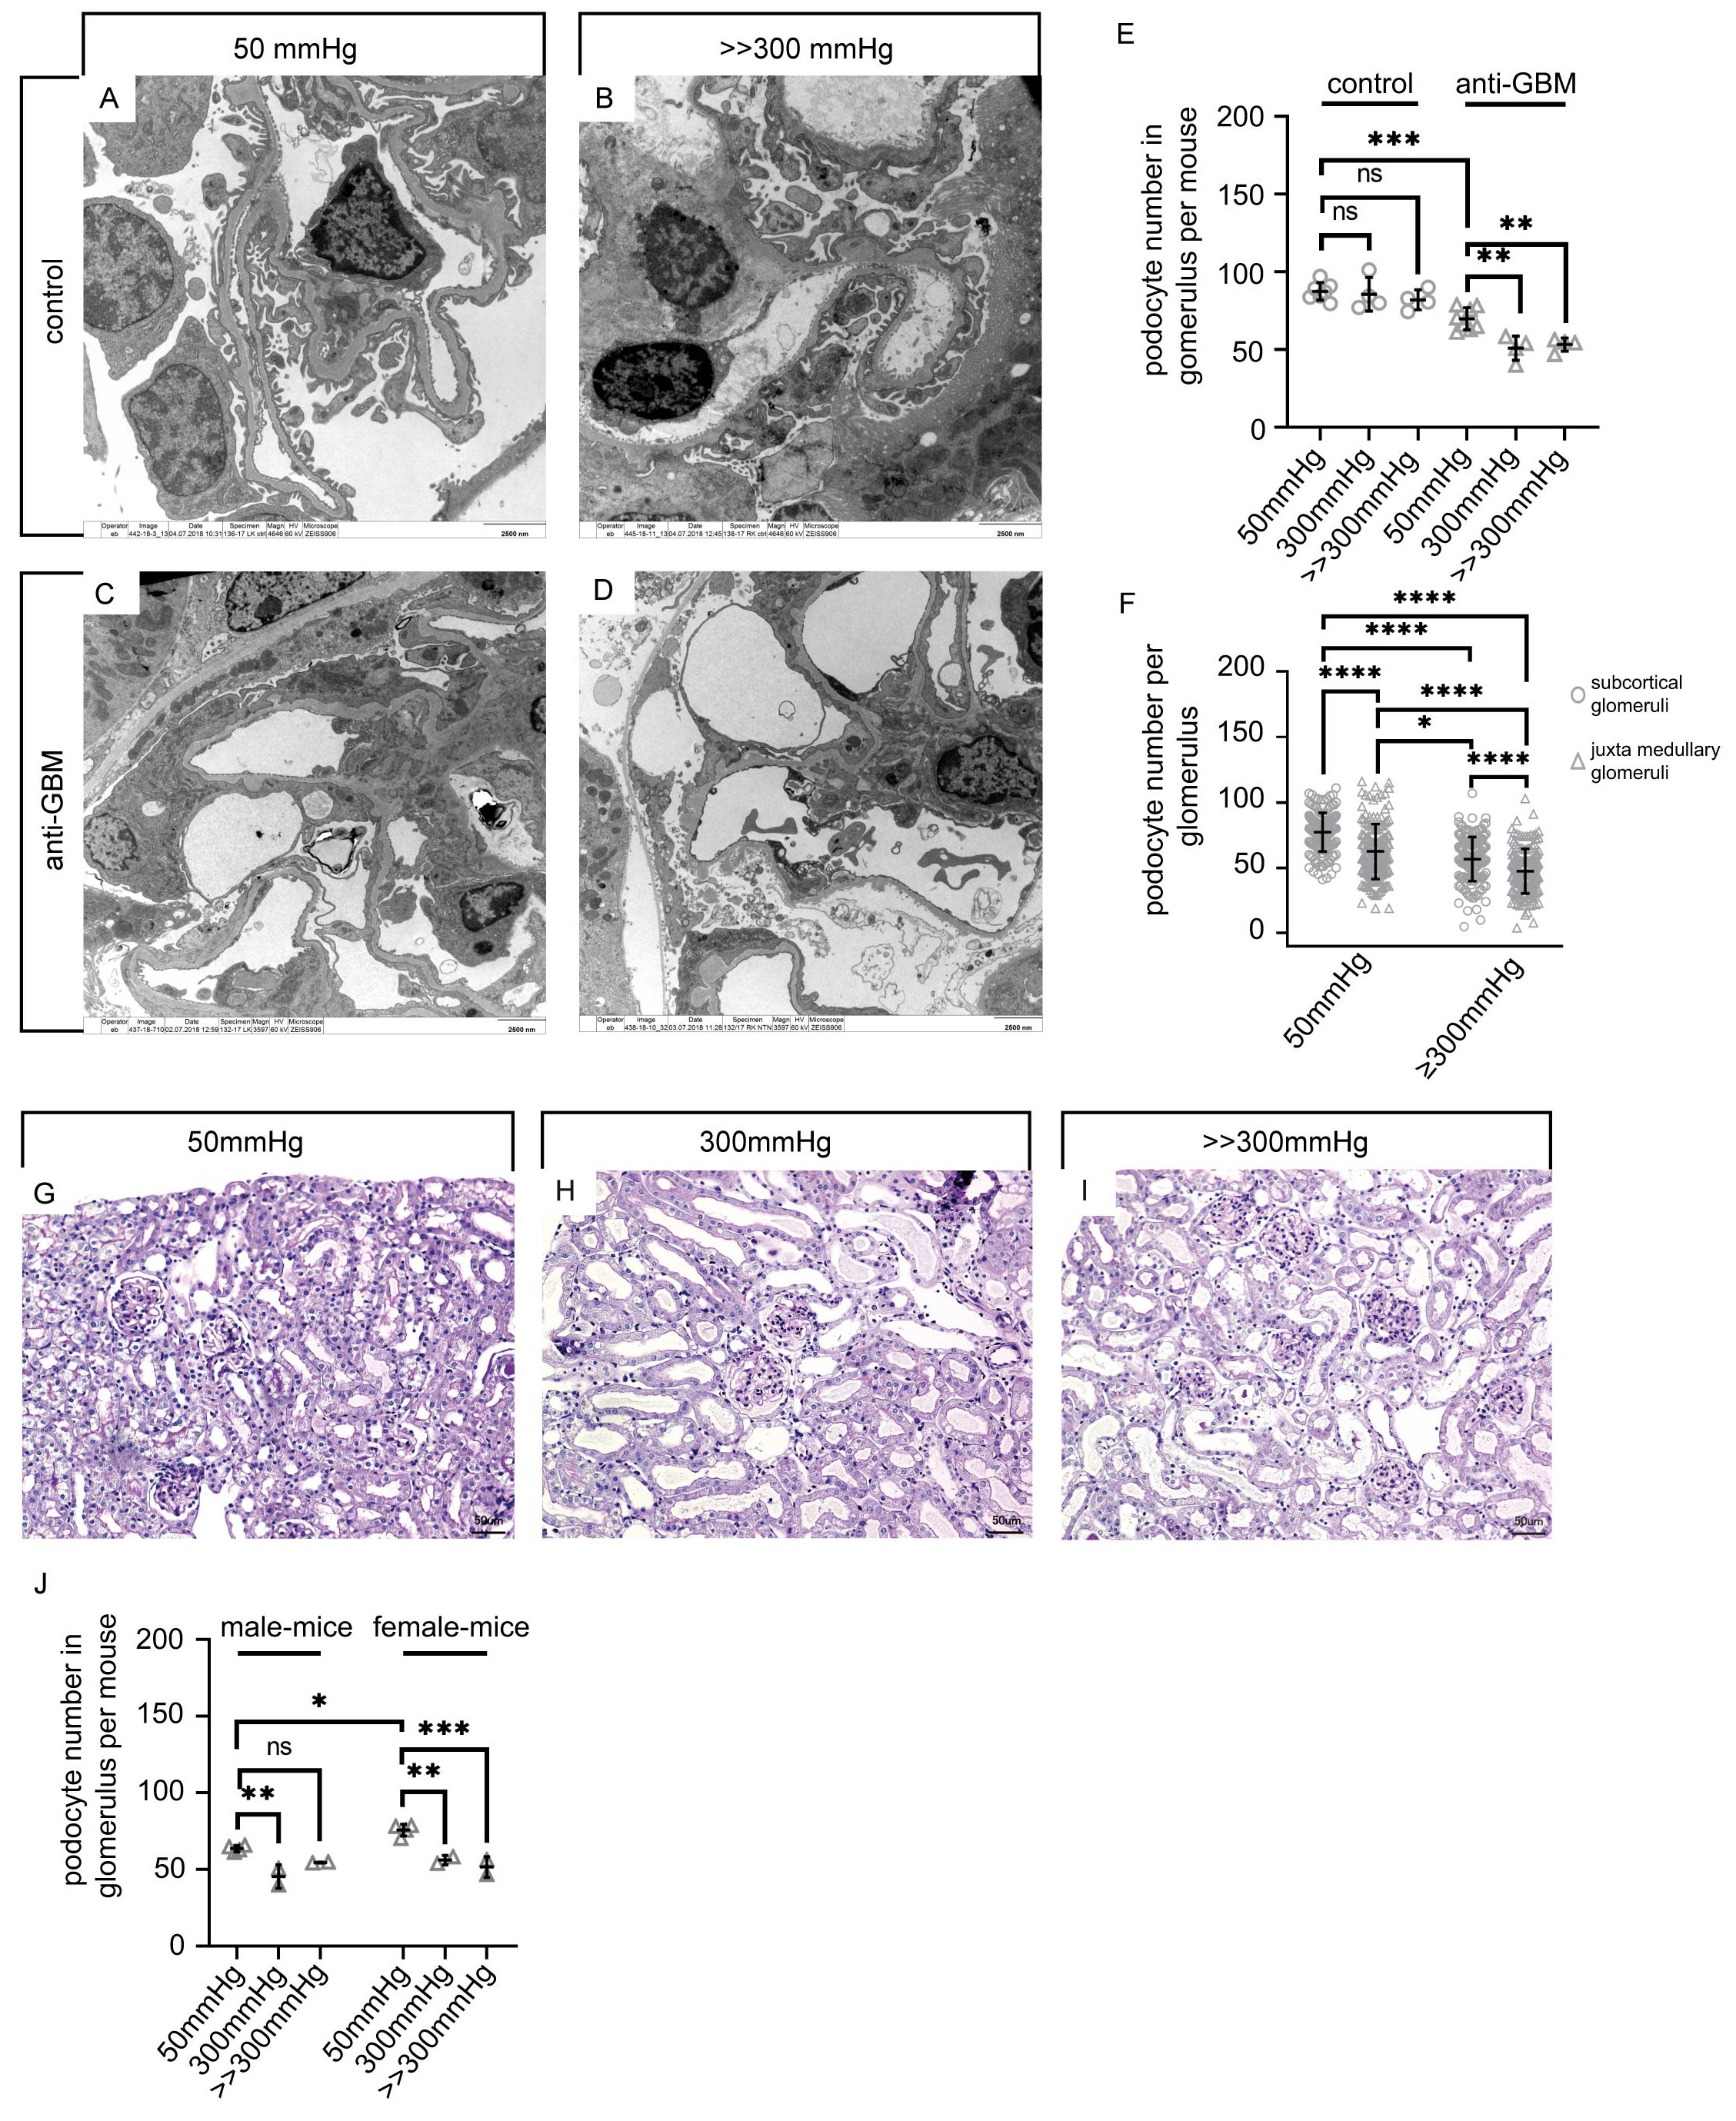
Fig. 3. Podocyte loss after acute injury. (A-B) Transmission electron microscopy from a control kidney perfused at a low pressure and after supramaximal pressure (>>300 mmHg) showing normal foot process architecture. (C-D) Transmission electron microscopy reveals the typical finding of foot process effacement after injection of anti-GBM serum at baseline. After perfusion with higher pressure, areas of denuded basement membrane were observed. (E) Total number of podocytes per mouse in anti-GBM mice at baseline and under higher (300 mmHg) or supramaximal pressures (>> 300 mmHg); (each circle represents 1 kidney; n=7 control kidneys with 50mmHg, n=8 anti-GBM kidneys with 50mmHg, n=4 kidneys with 300 mmHg or >> 300mmHg). (F) Total number of podocytes per glomerulus in juxtamedullary and subcortical glomeruli; each circle represents 1 subcortical glomerulus (n= 20 glomeruli pro mouse) and each triangle represents 1 juxtamedullary glomerulus (n= 20 glomeruli pro mouse). (G-I) Histologic staining of anti-GBM mice at baseline identified protein casts, whereas three days after injection of anti-GBM serum no crescentic lesions could be found. After perfusion with higher pressure tubule-interstitial dilatation and edema were observed. (J) Total podocyte number per mouse between males and females; each circle represents 1 kidney (n=4 control kidneys with 50mmHg, n=4 anti-GBM kidneys with 50mmHg, n=2 kidneys with 300 mmHg or >> 300mmHg). For multiple comparisons ANOVA. ****P<0.0001, ***P < 0,0001, **P<0.01, *P<0.05 and ns and ns = not statistically significant; error bars represent means ± SD.